A Software Engineer's Guide to Observability: Part 2 - APM & Distributed Tracing


Blueground Engineering's observability guide to APM: why tracing matters, auto-instrumentation strategies, custom span best practices, and AI-enhanced debugging workflows
In Part 1, we covered logging as your forensics tool for understanding what happened after you've identified a problem. Logs are great at telling you what occurred, but they leave you guessing about the how fast and the where.
Picture this: A user complains that checkout is slow. You check the logs. You see the request came in at 14:23:01.234 and the response went out at 14:23:09.891. Cool. 8.6 seconds. But why? Was it the payment gateway? A database query? A retry loop somewhere? All of the above?
Logs alone won't tell you. That's the gap that APM (Application Performance Monitoring) and distributed tracing fill.
Why APM
APM is a category of tooling that continuously monitors the performance and behavior of your application in production tracking things like request latency, error rates, throughput, and the time spent in individual code paths.
Here's a concrete scenario. You're running a property rental platform. Monday morning, your alerting fires: Core Web Vitals are degrading. LCP is creeping past 3 seconds on your search pages, and your conversion funnel is starting to show it. You check your logs requests are coming in, responses are going out, no obvious errors. Everything looks fine on the surface.
You open your APM dashboard. Immediately, you can see that search requests have been trending up in latency for the past two hours. The flame graph for a representative request tells the story at a glance: the application server is fast, but there's a 2 second gap sitting inside a call to the pricing service. Drill into that span and you find a database query doing a full table scan on a 400k row table, an index that was never added when the feature launched six months ago.
Without APM, you would have been digging through logs for hours trying to correlate timestamps across services. With it, you had a root cause in minutes.
How APM and distributed tracing work
At its core, APM instruments your application to record spans, discrete units of work with a start time, duration, and attached metadata. These spans are shipped to a central collector (Datadog, Honeycomb, Jaeger, etc.) where they can be queried, visualized, and alerted on.
Distributed tracing is what happens when a single user request touches multiple services. Each service emits its own spans, but they're stitched together into a single trace using a shared trace_id that propagates through HTTP headers, message queue payloads, and async jobs. The result is an end-to-end timeline of everything that happened across every service for a single request.
If APM is the monitoring layer: dashboards, latency percentiles, error rates, throughput, then distributed tracing is the investigation layer, a detailed map of what actually executed when a specific request came in. Together, they give you both the signal (something's wrong) and the explanation (here's exactly where and why).
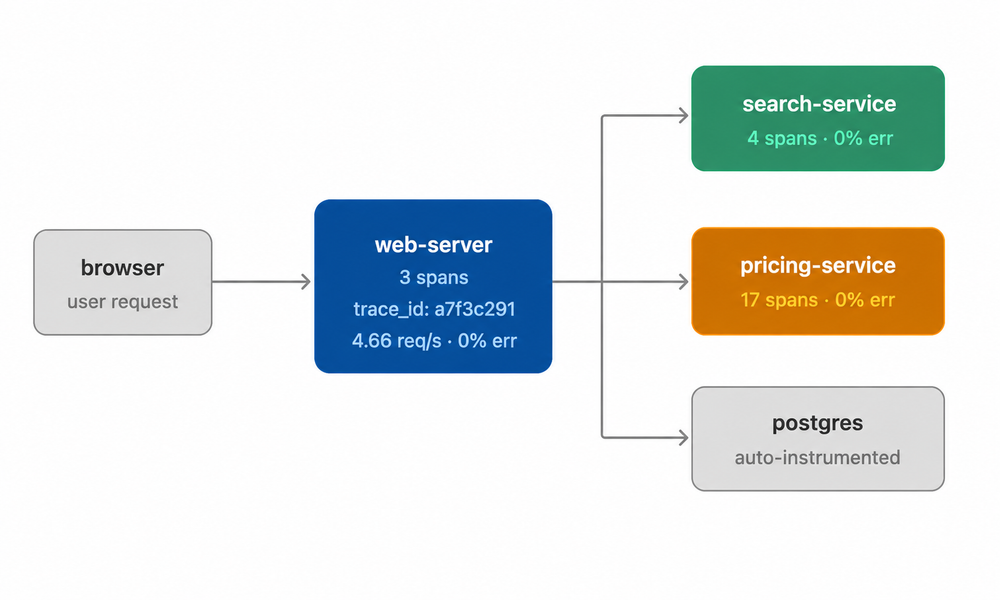
All spans share trace_id a7f3c291 — stitched into one unified trace in the APM collector
What is auto-instrumentation?
Auto-instrumentation is the practice of having your tracing library automatically capture telemetry data without you writing any tracing code. You add the library, configure a few environment variables, and it patches common frameworks and drivers at runtime to start emitting spans.
Without writing a single line of custom tracing code, you get:
- HTTP requests and responses (inbound and outbound)
- Database queries (SQL, NoSQL, Redis calls)
- Message queue operations (Kafka, RabbitMQ, SQS)
- Common framework operations (Express routes, Koa middleware, Fastify handlers)
- Automatic trace context propagation across service boundaries
That last one is subtle but critical. Auto instrumentation doesn't just trace individual services, it connects the traces across service boundaries so you get a unified view of the entire request journey.
What does auto-instrumentation miss?
Auto-instrumentation is powerful, but it has a blind spot: your business logic.
It sees HTTP calls and database queries, but it doesn't know that you're "calculating pricing" or "validating inventory" or "processing a refund." It doesn't understand the chapters of your request's story, only the infrastructure-level sentences.
This is where custom instrumentation become critical.
Where to add custom instrumentation
Not everywhere. Every span has indexing, CPU overhead, memory and network cost to ship the data. The key is instrumenting what matters.
1. Instrument business-critical operations
If it matters to your business, it should have a span. Not just for performance tracking, but for understanding when and why operations fail.
const tracer = require('dd-trace');

async function createBooking(bookingData) {
  const span = tracer.startSpan('booking.create', {
    tags: {
      'booking.market': bookingData.market,
      'booking.business_model': bookingData.business_model
    }
  });

  try {
    const booking = await saveBooking(bookingData);
    span.setTag('booking.id', booking.id);
    return booking;
  } catch (error) {
    span.setTag('error', true);
    throw error;
  } finally {
    span.finish();
  }
}
Now when bookings fail or slow down, you can filter by market or business_model and see patterns that would be invisible in aggregated data.
2. Wrap expensive or variable operations
If something might be slow—and you care about understanding when it is, wrap it.
This includes:
- External API calls (even if auto instrumented, add business context)
- Complex calculations (pricing, availability, routing)
- File operations (PDF generation, image processing)
- Batch operations (bulk updates, imports)
The pattern is the same as above: start a span with relevant tags, set additional tags on success, tag errors explicitly, and always finish in a finally block.
3. Add context with tags
Raw timing data is useful. Tagged timing data is actionable.
Tags let you filter traces by dimensions that matter to your business:
span.setTag('booking.market', 'NYC');
span.setTag('booking.property_type', 'studio');
span.setTag('booking.business_model', 'partner_network');
span.setTag('user.subscription', 'standard');
Now when you're investigating slow bookings, you can:
- Filter to specific markets and see if latency is region-specific
- Compare performance across property types
- Identify delay discrepancies between business models
- Correlate performance with user subscription tiers
This is the difference between "bookings are slow" (unhelpful) and "partner_network bookings in NYC for studio apartments are slow" (actionable).
Auto-instrumentation is your baseline. It gets you 80% of the value with 5% of the effort. But there's a gap...
How to shoot yourself in the foot with APM
Even with great intentions, tracing can become counterproductive. Here are the common pitfalls:
Tracing without correlation IDs: If your traces don't include the same trace_id that appears in your logs, you lose the ability to cross-reference. Always propagate trace context through your logging MDC.
Inconsistent span naming: Using create_booking, createBooking, and booking-create across services breaks aggregation. Pick one convention (we use booking.create) and enforce it.
High-cardinality tags: Don't tag with unbounded values like user IDs, email addresses, or user-generated text—anything where the number of distinct values grows with your user base. Use low-cardinality dimensions instead: user.tier (enterprise, standard) rather than user.id, search.type or search.query. High-cardinality tags can increase APM costs 10x.
Sampling without strategy: 1% sampling saves costs but creates blind spots. Most APM platforms let you configure sampling rates, a practical approach: give your most critical applications (checkout, payment gateways) a high sampling rate, and apply lower rates to high-volume, lower-stakes services. Always capture 100% of errors regardless of the overall rate.
Ignoring trace context propagation: If you don't propagate trace context across service boundaries (HTTP headers, Kafka message headers), your traces fragment. You'll see disconnected segments instead of the full request journey. Auto-instrumentation handles most of this, but custom integrations need manual propagation.
APM as an afterthought: Instrumenting after an incident hits doesn't help much. Add tracing to new services from day one. Make span naming and tagging part of your code review checklist.
What happens when AI meets your traces?
The relationship between AI and APM is bidirectional and increasingly important as more of our code gets written (or co-written) by AI agents.
AI can help you build better instrumentation, and AI can help you understand the traces you collect. Let's look at both.
Keeping AI agents aware of your tracing standards
As AI coding assistants (Cursor, Claude, Opencode) write more of your code, they need to understand your instrumentation expectations. Otherwise, you end up with inconsistent span naming, missing tags, and gaps in your traces.
We've taken the same approach we use for logging: maintain tracing standards as markdown documentation in key repositories.
When you spin up a new service or add a new feature, AI agents can reference this documentation and generate properly instrumented code from the start.
Example TRACING.md in your service template:
# Tracing Standards
## Required Spans
### Auto-instrumented (no action needed)
- All HTTP endpoints
- Database queries
- Message queue operations

### Manual instrumentation required
- Business operations (booking.create, payment.process, etc.)
- External service calls (add business context even if auto-instrumented)
- Expensive operations (pricing calculations, PDF generation, etc.)

## Naming Convention
Format: `{domain}.{operation}` or `{service}.{operation}`

Examples:
- `booking.create`
- `payment.process`
- `pricing.get_quotes`

Use resource names for filtering:
- `resource="user_checkout"`
- `resource="total_reprice"`

## Required Tags
- `booking.market`: Geographic market (NYC, LON, DXB, etc.)
- `booking.property_type`: studio, one_bedroom, etc.
- `booking.business_model`: on_demand, core, partner_network, etc.
- `user.tier`: enterprise, standard, etc.

## Performance Budget
- Keep spans > 1ms duration (don't instrument trivial operations)
- Limit to < 100 spans per trace (indicates over-instrumentation)
- Set sampling rates appropriately for high-throughput endpoints
When AI agents (Cursor, Claude, GitHub Copilot) see this file, they can:
- Generate properly instrumented code for new features
- Add appropriate spans when refactoring existing code
- Suggest instrumentation improvements during code review
- Maintain consistency across services as new developers join
When an engineer asks Claude to "add a new payment method" Claude references the tracing standards and generates code with the right span names, the right tags, and proper error handling. Consistency by default.
Tracing as context for AI-assisted debugging
Now let's flip it around: using AI to understand your traces.
Distributed traces provide rich context that dramatically improves AI-assisted debugging. When you're troubleshooting with an AI agent, you're no longer describing the problem in abstract terms. You're showing the AI actual execution data.
Service maps extracted from tracing help both humans and AI agents build a mental model of service dependencies. When an AI agent is helping you debug a slow checkout flow, feeding it the actual service topology from APM shows it the real dependency graph and not an outdated architecture diagram from six months ago that nobody updated.
Code + traces together = powerful root cause analysis. An AI agent analyzing a slow endpoint can correlate:
- The code path (from your repository)
- Actual execution traces (from APM)
- Performance metrics (from the APM platform)
This lets it identify issues that aren't obvious from code review alone:
- N+1 queries that only appear under specific data conditions
- Redundant service calls that could be batched
- Cache misses that trigger expensive recomputation
- Sequential calls that could be parallelized
It's the difference between "this code block looks inefficient" and "this code block is causing 2-second delays for enterprise bookings in NYC."
AI-powered workflows: From trace to fix
The challenge with distributed tracing? Traces are complex. A single user request might generate 200+ spans across 20 services. Manually expanding every span to find the bottleneck is tedious. It's like reading a 300 page book to find one paragraph.
This is where AI agents shine not just for analyzing traces, but for orchestrating entire debugging workflows. Let's look at practical use cases.
Use Case 1: Explaining complex traces
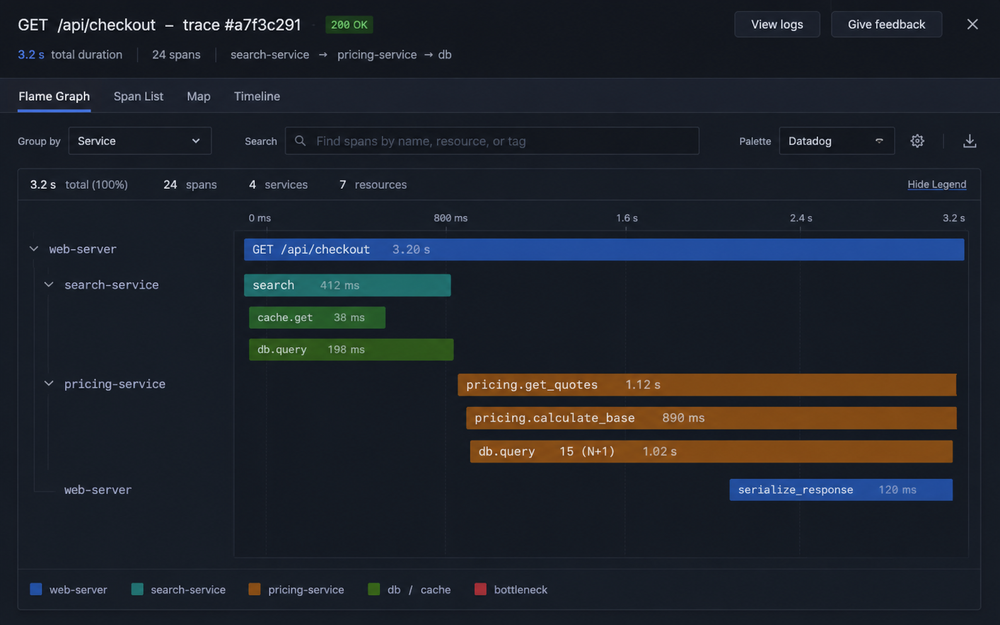
The simplest AI use case: take a screenshot of a flame graph and ask an agent to explain it.
You: [Upload screenshot of flame graph]
    "What's wrong with this trace?"

Agent: "This trace shows a 3.2s checkout request. The bottleneck is
     in pricing.get_quotes (2.8s), which is making 15 sequential
     database queries—classic N+1 problem. Each query takes ~180ms.

     The queries all hit the price_vector table with different
     filters. This should be a single query with an IN clause
     or a batch lookup."
No need to manually expand every span or correlate timings. The AI sees the pattern instantly.
Use Case 2: End-to-end debugging workflow
Here's where it gets powerful. AI can orchestrate the entire debugging cycle:
Step 1: Identify the slow query in APM
You: "I can see high latency in booking API for the booking service in the      last 24 hours, can you help me identify the reason?"

Agent: [Analyzes the traces]
    "Found the bottleneck: database query in pricing.get_quotes
     taking 2.1s (p95).

     Query: SELECT * FROM price_vector WHERE market = ?
            AND property_type = ? AND active = true

     This is doing a full table scan. Missing index on
     (market, property_type, active). Table has 423k rows."
Step 2: Execute the fix
Now you can give the AI a complete execution plan:
You: "Here's the plan:
     1. Create a branch for this fix
     2. Add a migration script for the missing index
     3. Deploy to an ephemeral preview environment
     4. Run booking e2e tests
     5. Validate the fix using APM traces
     6. Comment the improvement on the PR"

AI: [Executes the full workflow]

    1. Created branch: fix/add-pricing-rules-index

    2. Generated migration: 20250320_add_pricing_rules_composite_index.sql

       CREATE INDEX idx_pricing_rules_market_property
       ON pricing_rules(market, property_type, active)
       WHERE active = true;

       Committed and pushed to branch.

    3. Deployed to ephemeral environment: preview-pr-1247
       Migration applied successfully.
       Preview URL: https://preview-pr-1247.blueground-internal.com

    4. Running booking e2e tests against preview environment...
       ✓ 47 tests passed (booking-flow.spec.js)
       ✓ 0 failures

    5. Querying APM for booking.create traces in preview-pr-1247:

       Before (production): p95 = 2.1s (pricing.calculate_base: 2.0s)
       After (preview):     p95 = 320ms (pricing.calculate_base: 180ms)

       ✓ 11x improvement confirmed
       ✓ Query now uses idx_pricing_rules_market_property

    6. Posted comment on PR #1247:

       "✅ Performance improvement validated in preview environment

       **APM Analysis:**
       - p95 latency: 2.1s → 320ms (11x improvement)
       - Bottleneck resolved: pricing.calculate_base now uses composite index
       - Query plan confirmed: idx_pricing_rules_market_property

       **Test Results:**
       - 47/47 e2e tests passing
       - Preview environment: preview-pr-1247

       Ready for review and merge."
This is the workflow we're building toward at Blueground. The AI doesn't just tell you what's wrong, it fixes it, deploys it, and verifies the fix. All orchestrated through APM data and MCP-connected tools.
Implementing with AI - Using AI to set up and maintain tracing
Similar to our logging setup (from Part 1), we provide AI coding assistants with a reference to our tracing policy and define commands for applying it.
your-repo/
├── tracing-policy/
│   └── tracing-policy.yaml        # pointer to your tracing standards
├── .cursor/
│   └── commands.apply-tracing.md
├── .claude/
     └── commands.apply-tracing.md
Tracing policy file:
version: 1
policy_outline: "https://yourcompany.getoutline.com/tracing-policy"
Claude/Cursor Commands file:
# /apply-tracing

Context: The tracing policy at ./tracing-policy/tracing-policy.yaml
Action: Refactor the selected code to include appropriate custom spans
        following the policy. Output a unified diff + rationale.
When an engineer or AI agent is adding a new feature, running /apply-tracing will:
- Identify business-critical operations that need spans
- Add appropriate tags based on the domain context
- Ensure span naming follows your convention
- Check for error handling and tag errors appropriately
It's not perfect, but it's a forcing function for consistency. And consistency is what makes observability data useful at scale.
Getting started with APM & Tracing
If you're not using APM yet:
- Start with auto-instrumentation on your most critical service (e.g., checkout, payment processor)
- Observe the service map for a week—you'll likely discover services calling services you didn't know about, or bottlenecks that were completely invisible in logs
- Add 3-5 custom spans around your slowest or most business-critical operations
- Tag liberally with low cardinality dimensions you'll want to filter by during incidents (market, user tier, product type)
- Document your standards in a
TRACING.mdfile so both humans and AI know what's expected
If you're already using APM:
- Audit your custom instrumentation—are you tracking what actually matters?
- Review your tags—can you slice traces by the dimensions you care about?
- Experiment with AI-assisted trace analysis—feed trace data to an AI agent during your next debugging session
- Update your docs—make sure tracing expectations are discoverable in your repos
- Check your sampling strategy—are you capturing enough high-value traces without breaking the budget?
Key takeaways
- Tracing shows you the path and performance—logs tell you what happened, traces show you how long it took and where.
- Start with auto-instrumentation, then layer on custom spans for business-critical operations.
- Tags are your filter dimensions—tag spans with context you'll want to query during incidents.
- AI amplifies tracing value—AI can summarize traces, detect anomalies, and orchestrate full debugging workflows from trace to verified fix.
- Don't over-instrument—every span has a cost. Instrument what matters.
- Tracing + logs + correlation IDs = full observability—they're complementary, not alternatives.
Looking ahead
In Part 3, we'll explore Metrics & SLOs—the numbers that tell you how your system is performing and whether it's meeting expectations. While logs and traces help you troubleshoot after identifying a problem, metrics are what alert you that there's a problem in the first place.
We'll cover:
- What metrics to collect (and what to skip)
- How to avoid cardinality explosions
- Setting SLOs that actually matter